A KWL chart turns a lesson into a visible record of what students think they know, what they want to find out, and what they learned. This three-column graphic organizer surfaces prior knowledge, shapes questions, and allows students to return to them after reading, investigation, or instruction.
What a KWL Chart Reveals Before, During, and After Learning
KWL stands for Know, Want to know, and Learned. The K column captures what students bring to a topic before a lesson. The W column holds the questions they hope to answer. The L column records new understanding after the work is done.
This sequence allows students to see their thinking change rather than merely collecting facts. The chart serves as a living document rather than a worksheet completed in one sitting. Revisit it throughout a unit, add questions, and return to early statements when new evidence clarifies them.
In 1986, Donna M. Ogle introduced the K-W-L model in an article about active reading of expository text. Its format makes a learner’s starting point and questions visible to both the class and the teacher.
How to Use a KWL Chart in Six Classroom Moves
- Introduce the topic. Draw three columns on the board or hand out a chart to students.
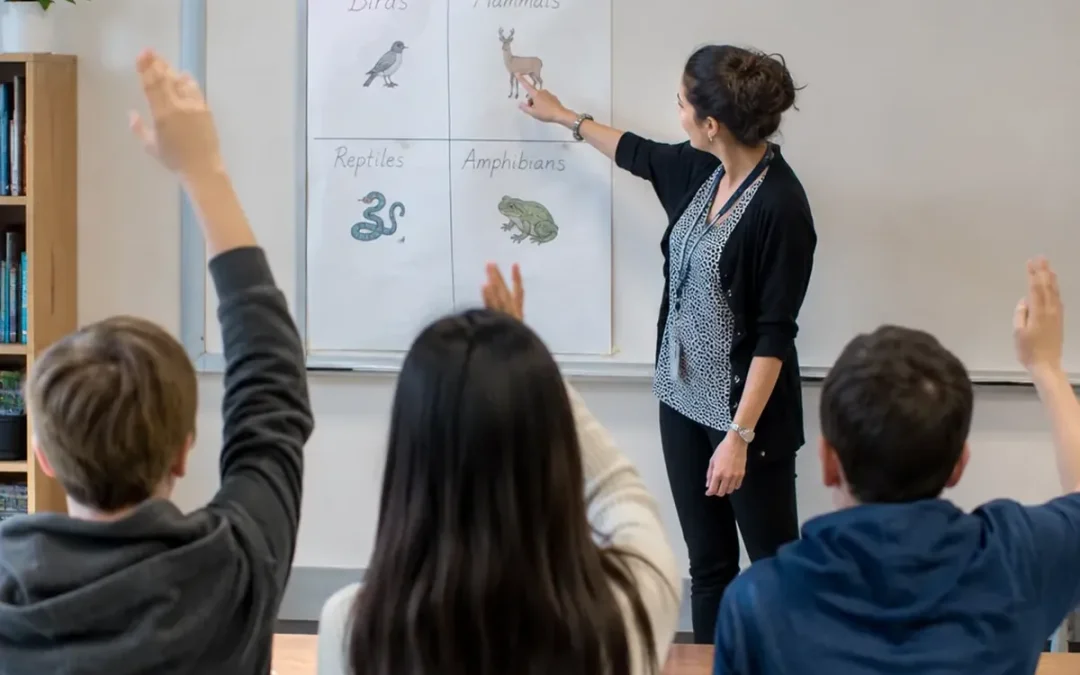
- Open the K column. Invite individual thinking, partner talk, or a group brainstorm about what students already know about a topic.
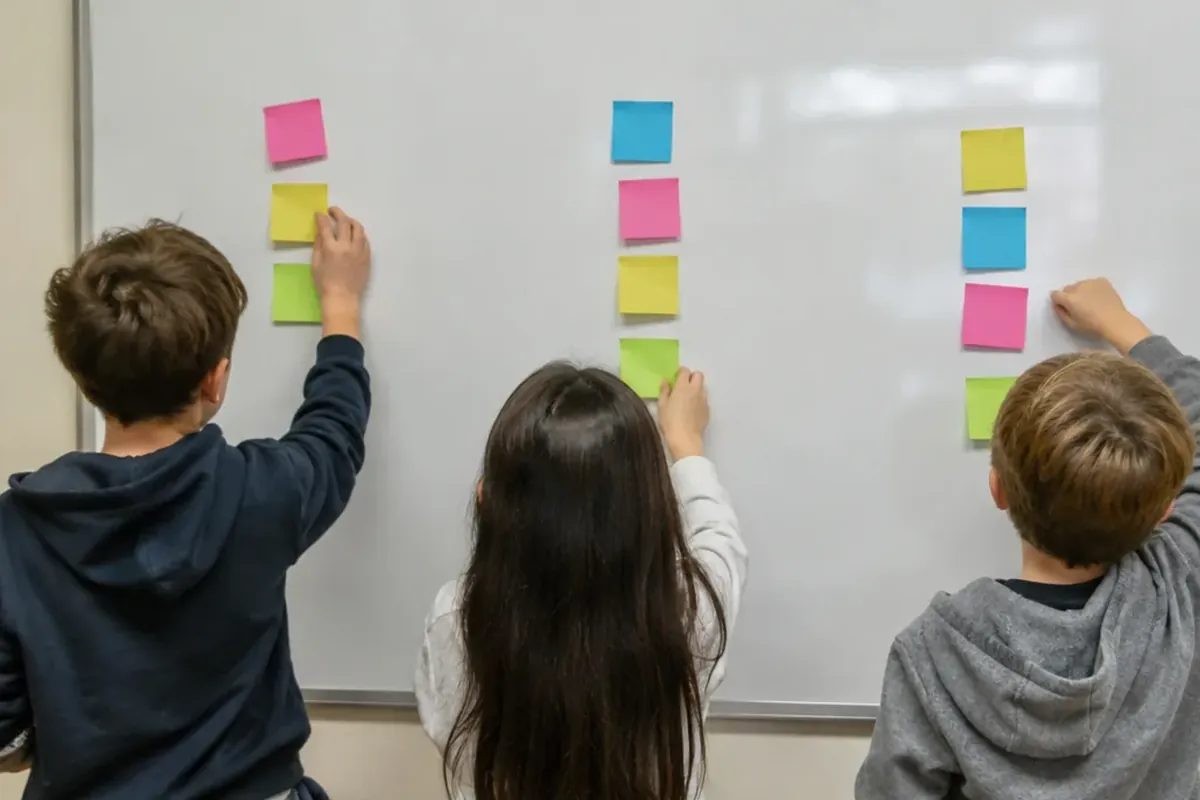
- Build the W column. Ask for specific questions. Prompts using who, what, when, where, why, and how help turn broad statements into focused questions.
- Connect questions to the unit. Share the learning goals and link them to the class’s questions in the W column.
- Return to the chart during learning. While students read, research, or take part in instruction, let the W column guide attention.
- Complete and discuss L. Have students record what they learned, check which questions were answered, and correct misconceptions from the K column. End by comparing all three columns to reflect on how thinking changed.
Teachers should not leave misconceptions in the K column unaddressed; instead, bring them up and correct them through the instruction that follows.
Turn a Familiar Topic into Better Questions
In an elementary science lesson on the water cycle, a chart develops this way:
| Know | Want to know | Learned |
|---|---|---|
| Water can be liquid, ice, or gas. | How does rain form? | Evaporation needs the sun’s heat, and condensation forms drops. |
Across subjects, the structure adapts to different grade levels. In preschool, children can draw pictures of farm animals and ask what cows eat. In middle school history, students can start with “Egyptians built pyramids,” ask how heavy stones were moved, and record the role of ramps and teamwork. In math, students can identify that fractions have numerators and denominators, ask how to add fractions with different denominators, and record why a common denominator is needed.
Use the Chart as a Quick Formative Assessment
A KWL chart serves as a tool for formative assessment. At the start of a unit, the K column exposes prior knowledge and possible misconceptions. Across the lesson, W shows what is confusing or compelling, while L offers a quick, informal check of whether learning goals were met.
Collect K entries before instruction begins to review misconceptions systematically. Keep a class chart visible to adjust lesson plans and examples around student questions. In the L column, ask students to support their answers with evidence or a source.
Why This Strategy Helps Students Learn with Purpose
- It activates prior knowledge before students encounter new material.
- It gives reading and research a purpose through student-formulated questions.
- It supports differentiation because students enter from different starting points.
- It prompts metacognition when students compare K with L to see how their understanding changed.
- It supports visual learners, young learners who draw instead of write, and English language learners.
A chart that stops after the opening brainstorm functions only as a warm-up. Completing the full cycle and returning to the questions makes it an effective tool for reflection.
Avoid the Mistakes That Flatten the Learning
Myth: The K column should contain only correct answers
The K column often surfaces misconceptions. Rather than ignoring them, address and correct them during the lesson. To encourage tentative ideas without fear of being wrong, some classrooms label this column “What I think I know.”
Myth: Students can fill in W without discussion
Without discussion, a W column often produces compliance answers. Help students formulate specific questions, and incorporate those questions into subsequent lessons so students stay motivated.
Myth: L is just a final sentence
Skipping or rushing the L column removes reflection. Ask students to substantiate their answers with sources. When introducing the chart, providing a row with an example makes the template easier to use than a blank grid.
Choose an Alternative When Three Columns Are Not Enough
When lessons require planning, evidence, or synthesis, extensions of the standard KWL format can be used.
| Format | What it adds | Best fit |
|---|---|---|
| KWHL | How will I find out? | Students plan research using books, online searches, experiments, or expert interviews. |
| KWLS | Still want to know | Documenting unanswered questions for subsequent learning. |
| KWL+ | Concept mapping and a summary | Organizing L information into a concept map and writing a summary. |
| KWHLAQ | How, Action/Application, New Questions | Inquiry projects requiring research planning, application, and follow-up questions. |
| KLEW | Evidence and Wonderings | Science instruction emphasizing observation and evidence. |
Other alternatives include schema maps to distinguish whether new information extends or corrects prior knowledge, the Frayer Model for in-depth analysis of a single term, and exit tickets when only an end-of-lesson check is needed.
Customize the Format for Your Students and Setting
KWL charts can be created on paper, whiteboards, or digital slides and documents. For a hands-on option without a printer, students can fold paper into thirds. Digital whiteboards allow real-time collaboration.
Customize the format to suit the instructional purpose: encourage drawings in early childhood, add a How column for inquiry units, or use KWLF to have students record sources and practice citation.
Frequently Asked Questions
What is the 3-2-1 reading rule?
The 3-2-1 reading rule is an independent reading strategy separate from KWL. After reading, students write three things they learned, two interesting points, and one question they still have. It serves as a post-reading comprehension check rather than a before-during-after organizer.
How do KWL charts work during a unit?
Students begin with K and W, use their questions to guide reading and investigation, and complete L as their understanding develops. The chart is revisited throughout the unit rather than filled in only at the end.
What can I use instead of a KWL chart?
Options include schema maps, the Frayer Model for single concepts, exit tickets, or extended formats such as KWHL, KWLS, KWL+, and KWHLAQ.
Can I customize or create my own KWL chart?
Yes. Teachers can use digital templates, paper foldables, or add columns such as How to find out, Evidence, Sources (KWLF), or Still want to know.
What are the benefits of using a KWL chart?
It activates prior knowledge, provides a question-driven purpose for learning, fosters metacognition, and offers formative assessment data before, during, and after instruction.